Home/StatGL
Samples
StatGL Graphical Library:
A foundation for online graphical data analysis
Versions
Online version with shared and private data, software, solutions, methods, and graphics
Online version with dedicated server and private social network
Offline version with private resources, data, software and analysis
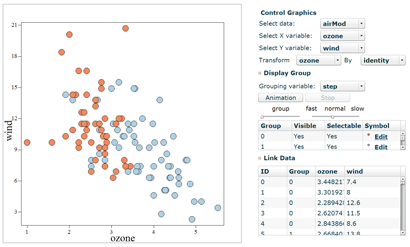
- Display Groups in Animation:
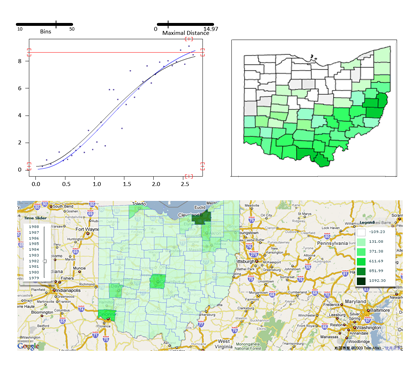
- Spatial Data:
To compare the difference between groups, we may apply different colors or symbols in a plot. When there are many groups, it will be difficult to visualize the difference clearly. An alternative is to apply animation, where we may watch one or two groups in one frame. We may continuously play the movie in the evaluation of a set of grouping variables.
Apply spatial-temporal visualization and modeling methods to space-time data. Overlap statistical graphics with Google Maps to study the real time geographical information and the regional disparity. Study the fitted map, the residuals and the impacts from other variables.
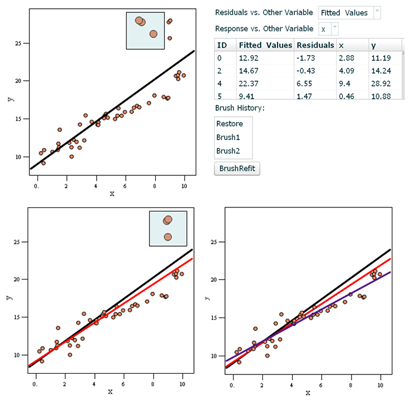
- Brush and Refit:
- Dropout Data:
In regression, we often find that there are records not following the modeling assumption. To study the impacts from such records, we have to evaluate their sensitivity on the fitted model. One way is to apply the bush-and-refit, where a set of targeted outliers are brushed and a new fit is derived. A large difference in the fits indicates a large departure from the modeling assumption.
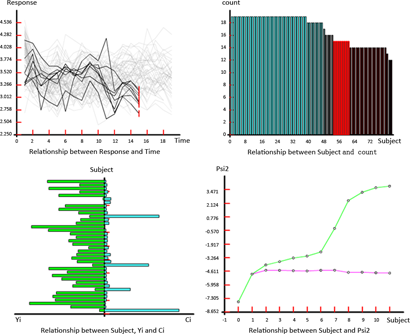
Linked dynamic graphics for the analysis of dropout data. Apply animation
for visualizing the sensitivity of modeling assumption. Evaluate the relationship between the normal curvature (an indicator for influential cases) and the imputed missing values.